
Interface outages can be devastating to clinical workflows and providers. Yet most organizations do not have good tools in place to monitor interfaces and ensure that their interoperability team is proactively alerted about active or emerging interface issues.
Zen manages millions of messages flowing through our fully hosted and managed infrastructure every month and has identified some best practices to ensure data feeds stay healthy.
Here are three ways to keep your data flowing in your interface engine / platform:
- Implement an “always-on” alerting strategy. This means that a new interface (channel) cannot accidentally be “left out” of your alerting / monitoring process.
- Leverage statistical metrics to generate batched alerts across all production instances, dramatically reducing “noise” that arises from the normal variation in an individual interface’s behavior. For example – a single alert on interface error rates is automatically tuned to only trigger if the error rate change is statistically significant.
- Combine outbound proactive alerting with a historical dashboard view of an interface processing instance(s) or interface level behavior in regards to message volumes, error rates, and queuing behavior. This “look back” opportunity on recent interface behavior, combined with a proactive alert, gives your engineers exactly the information they need, when they need it.
The Zen Insight Alerting and Monitoring solution addresses these three critical needs (and more) and can be implemented in a handful of days. We use it in our own Gemini Integration-as-a-Service solution, but we also make it available for users of the most widely used open-source integration engine in the world – Nextgen (Mirth) Connect.
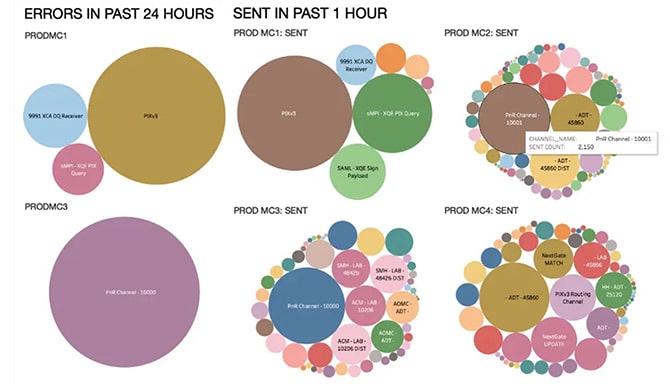
Example of a Zen Insight Hot-Spots Dashboard:
Want to learn more about how to optimize your alerting and monitoring strategy for your integrations? Click the link below.